In detail
Every part of the app, one screen at a time.
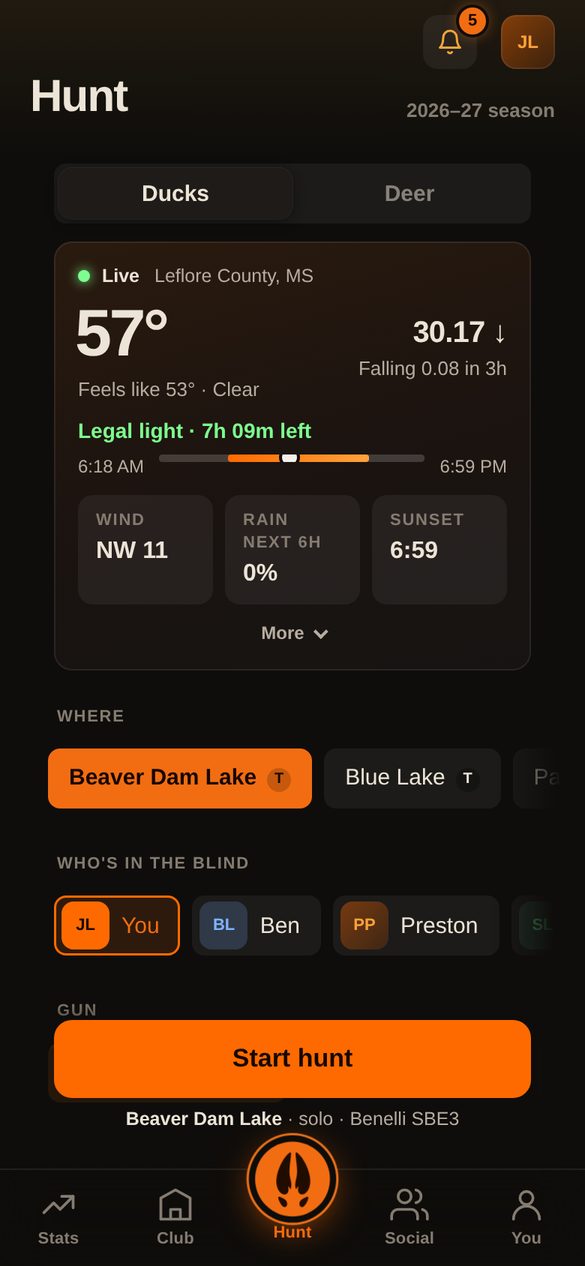
The morning, before you go.
One card: temperature, pressure, legal light, wind, rain, sunset. More one tap down.
- Legal light follows your state's rule
- Limits scale with everyone in the blind
- Season dates and splits
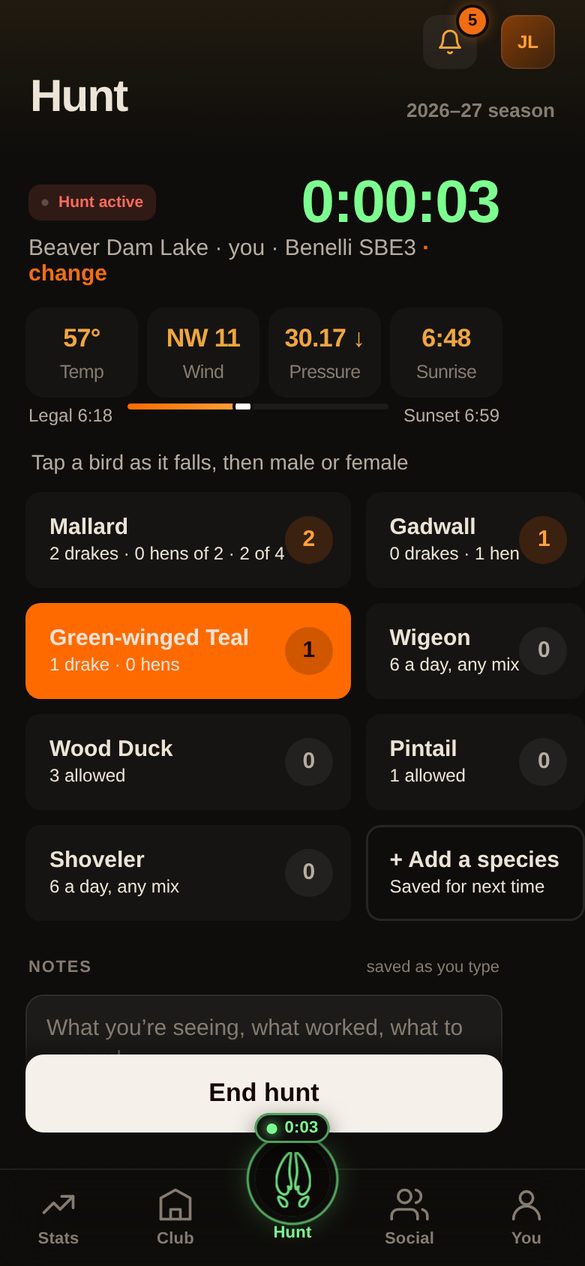
In the blind, with gloves on.
Tap the bird, tap male or female, done. The limit stamp lands at six. Notes save as you type.
- Glove mode
- Add a species on the spot
- Dogs and their retrieves
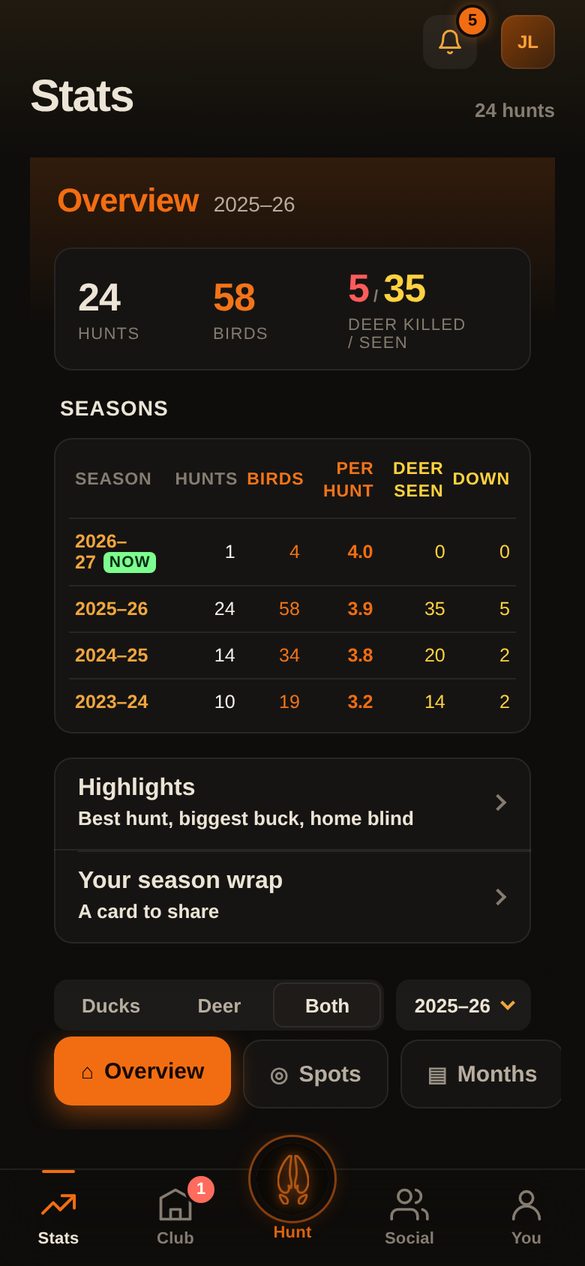
Stats under your thumb.
A dock at the bottom switches the view: Overview, Spots, Months, People, Species, Hunts.
- Same four columns in every table
- Spots show what fell there, by species
- Tap a row for the hunts behind it
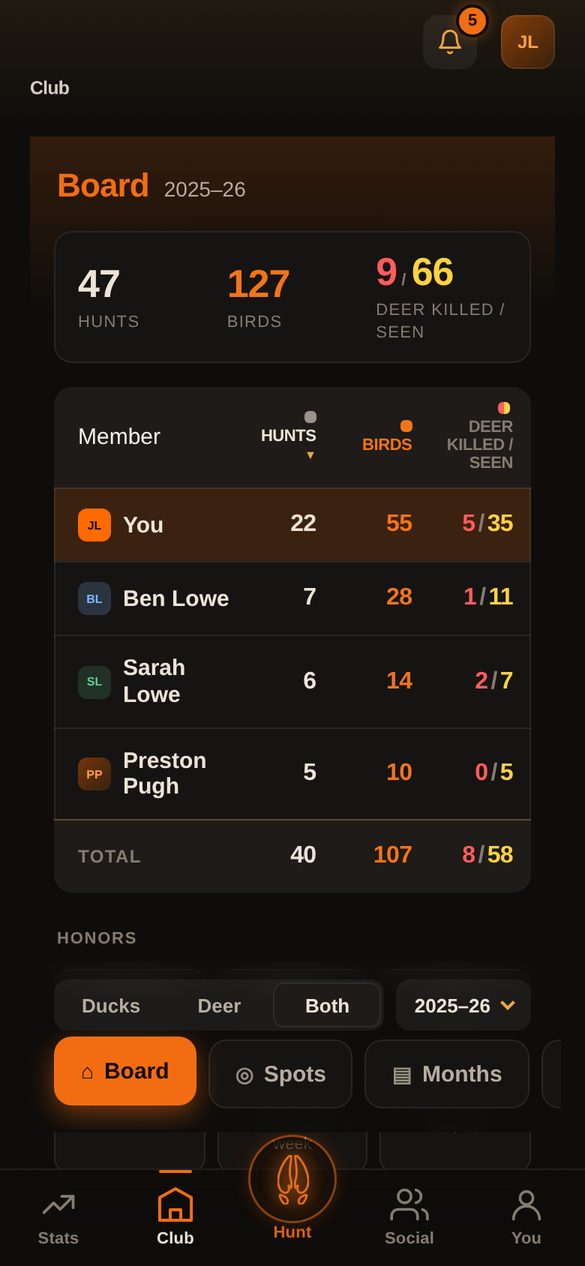
The club keeps itself.
Admins set the spots. Anyone who hunts one lands on the club log. The board ranks the season.
- A camp note pinned up top
- Who's out right now
- Invites and approvals in the app
A record of the mornings.
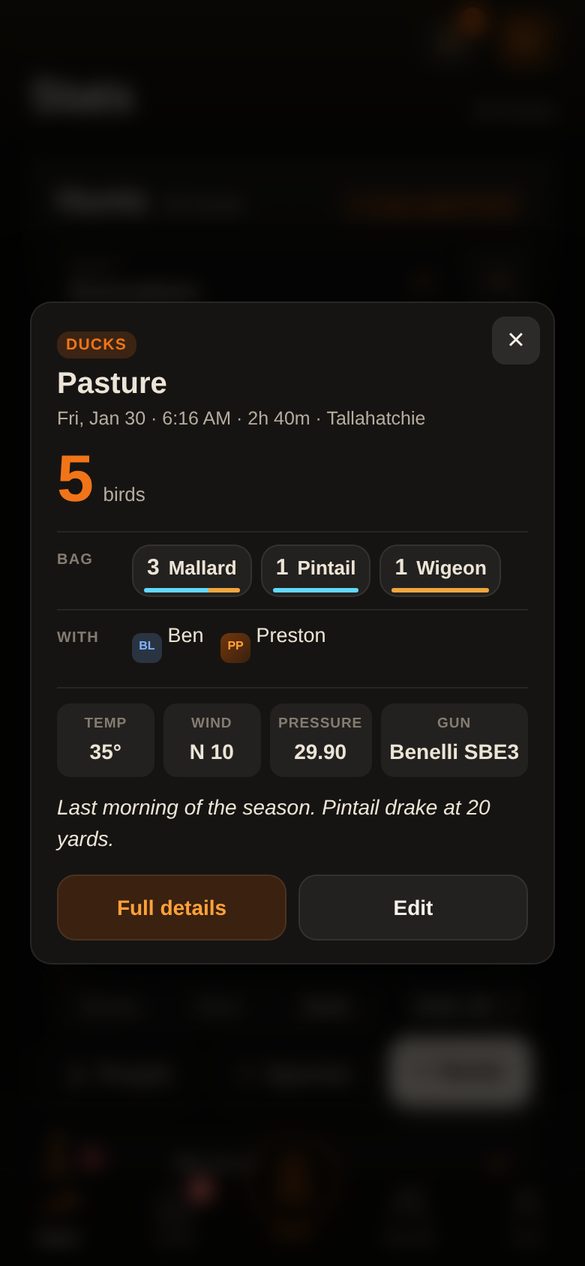
The note, the picture, who was there, what the weather did. Read it in twenty years.
- Log in the blind, that night, or years later
- Excel import: in development
- A journal that opens like a book. Print it every season, so the record never leaves
- Export the whole log any time
Friends, without the noise.
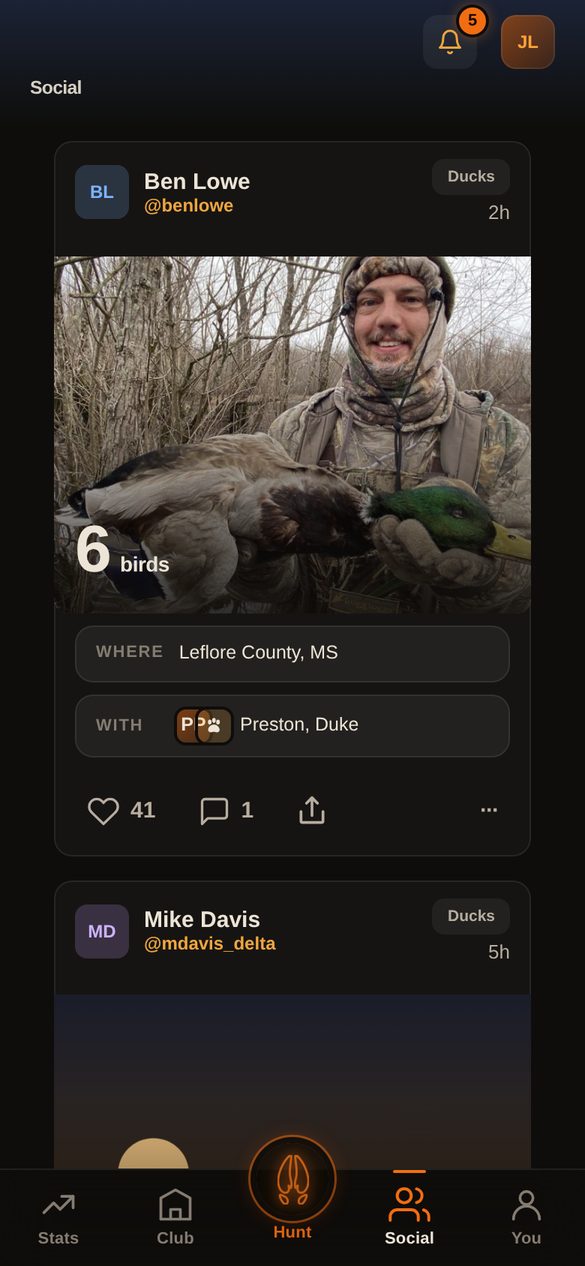
A post is who, the picture, the county, and the tally. That's it.
Who sees what
The rules, as the app enforces them.
Everything.
Only what you share. The county, never the spot.
Club-spot hunts: spot, date, tally.
Name, handle, home state.
Future Spoor
Every hunt logged makes the next one clearer.
Ducks and deer are where we start. Spoor is being built to log every kind of hunting there is, and to stay as simple as three taps while it does. The reason is what happens when thousands of people do it.
“Seeing more wood ducks this week. Birds are moving down here.”
One report, one hunter’s hunch. No county, no date, no weather, nothing to check it against. That is the state of the art, and it is what most of us plan a weekend around.
Every hunt logged is a data point.
County, date, legal light, temperature, pressure and its trend, wind, sky, what flew, what fell. One log is a diary. A hundred thousand of them, aggregated by county and week, is a live picture of what is going on out there. Nothing like it has ever existed.
It starts in the Delta: a few dozen counties, logged by the people who hunt them.
Illustrative projection, not a measurement. Every point is a county, never a pin.
Turkey, doves, geese, quail, hogs, elk, small game, each with its own seasons, limits and legal-light rules, on the same three-tap flow. Then fishing. The interface stays this simple on purpose: the easier the log, the more hunts get logged, and the more hunts get logged, the better the picture above.
Every logged hunt carries forty-plus fields, captured automatically: time and place, temperature, pressure and its trend, wind, sky, precipitation, moon, stage of season, what was seen and what was taken. It rolls up by county and week, and every season stacks on the last. That is a dataset no migration report has ever had.
As coverage grows, the map starts to move: where the birds showed up this week, how a front shifted deer sightings a county over, what hunters up the flyway are seeing right now. No more wondering why your friends two states over are on birds and you aren't. The answer is on the map, drawn from real hunts, not a hunch.